

Reports
Product Summary Total Comparison Report
The Product Summary Total Comparison report allows you to compare two product totals side-by-side across your book of business. It highlights differences between totals using a percentage comparison, making it easy to identify gaps, trends, or inconsistencies.
Before You Begin
Section titled “Before You Begin”For a product to appear in this report:
- The product’s product line must include both selected Summary Totals
- The product must have values mapped to both Summary Totals
- The product must have data associated to the Summary Totals being compared
If any of these conditions is not met, the product will not appear in the report.
What This Report Does
Section titled “What This Report Does”This report compares two Product Line Summary Totals (PLSTs) (for example, Total Cash Value vs. Total Surrender Value) across all applicable products.
It helps answer questions like:
- Which products have the largest gap between two values?
- How does one total compare to another over time?
- Which products are excluded due to missing configuration?
Each row displays both totals along with a percentage difference (Δ%), so you can quickly spot meaningful variances.
Practical use cases
Section titled “Practical use cases”- Compare Total Cash Value vs. Total Surrender Value
- Compare Total Account Value vs. Total Premium Paid
- Compare totals across different product lines (e.g., Life vs. Annuity)
How to Access the Report
Section titled “How to Access the Report”- Open the left-hand navigation
- Click Reports
- Select Product Summary Total Comparison
Build the Report
Section titled “Build the Report”-
Go to the Product Summary Total Comparison Report
-
Click Filter
-
From the Compare section choose Summary Total 1 and Summary Total 2
*You cannot select the same total twice
-
Review the calculation preview in the Equation tile
-
Click Filter
Options to Customize the Report
Section titled “Options to Customize the Report”-
You can refine results using:
- Dollar ranges (Min / Max)
- Percentage difference ranges (Δ%)
- Date filters (Opened, Submitted, Issued, Effective, Closed)
-
Use Contact Filters
-
Use Product Filters
Further Refine (once filtered)
Section titled “Further Refine (once filtered)”- Sort by clicking any column header
- Search by product owner or product number
- Toggle Hide Archived Products (enabled by default)
Understanding the Results
Section titled “Understanding the Results”Summary Widgets
Section titled “Summary Widgets”The totals at the top show the sum of each Summary Total across all visible products.
These values update dynamically based on your filters. Below, is the Total Cash Value and Total Surrender Value comparison with no date filter:
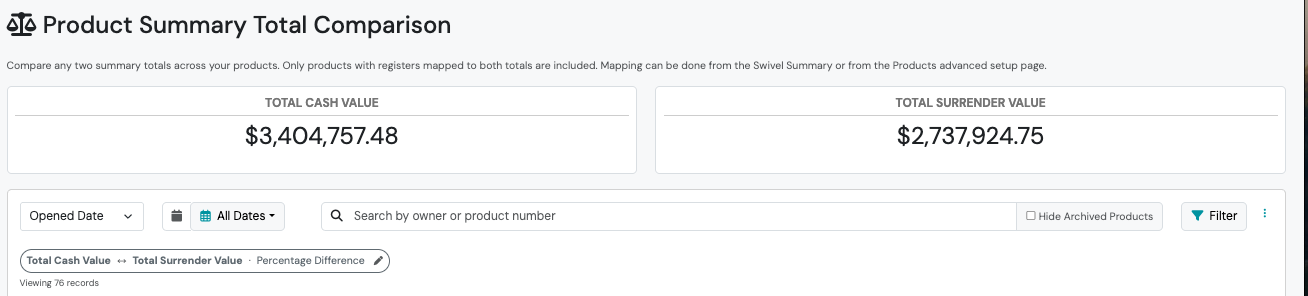
Table Columns
Section titled “Table Columns”- Date: Based on selected date type (may show — if missing)
- Owner: Product owner(s)
- Agent of Record: Assigned agent
- Institution: Associated institution
- Product: Clickable product number
- Summary Total 1 / 2: Calculated totals
- Δ%: Percentage difference between totals
Export the Report
Section titled “Export the Report”To export your results:
- Click the three-dot menu (⋮) next to Filter
- Select Export
- Confirm the export
The file downloads as a CSV and includes:
- All visible products
- Applied filters
- Summary totals and percentage differences
FAQs & Troubleshooting
Section titled “FAQs & Troubleshooting”Why a Product Might Not Appear?
Section titled “Why a Product Might Not Appear?”If a product is missing, check the following:
- Both Summary Totals are selected
- The product line includes both totals
- Values are mapped to both totals
- The product has data associated to both totals
- The product is not archived (or toggle is off)
- The date range includes the product
- The product meets your filter criteria
Important: Products with a value of $0 will still appear. Missing mappings will not.
Can I compare more than two totals?
Section titled “Can I compare more than two totals?”No. This report supports comparing two totals at a time. For more complex analysis, export to CSV.
Why is Δ% blank?
Section titled “Why is Δ% blank?”Δ% is undefined when Summary Total 1 equals $0.
Do filters save?
Section titled “Do filters save?”Yes. Your filters are saved and restored on your next visit.
Does the export match what I see?
Section titled “Does the export match what I see?”Yes. The CSV reflects your exact filtered view.
Can multiple product lines be included?
Section titled “Can multiple product lines be included?”Yes, if they share Summary Totals with the same name.
How current is the data?
Section titled “How current is the data?”The report uses the most recent register values and updates on refresh.
What does this mean?
Section titled “What does this mean?”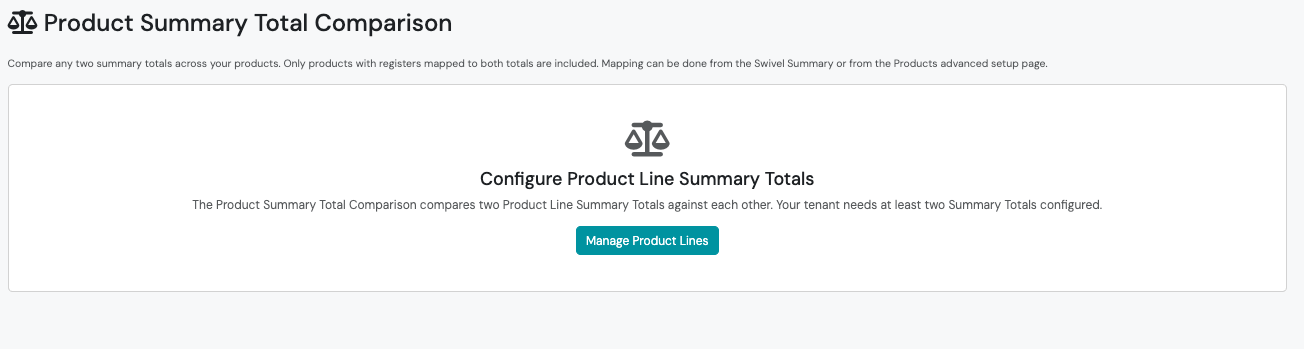
You need to Configure Totals. Click Manage Product Lines and follow the prompts.